Stocks finished higher today with the major indexes closing near session highs. In addition, the DJIA posted another new high. Investor participation was ok and market breadth was good. As a result, we are raising the support levels on the DJIA, S&P 500, and Nasdaq Composite (see below). Also, we are increasing the resistance level for the DJIA but leaving it the same for the S&P 500 and Nasdaq Composite (see below). Overall, we continue to believe the prudent approach is continue selling into strength and avoid becoming aggressive with opening new positions in stocks based on how far the stock market direction has run without a significant pullback. Don't let a position turn into a big loss if the market trend suddenly changes. If you need to own stocks, please see our open watch list below.
SUMMARY
DJIA: Up 0.9% to 11,981
S&P 500: Up 0.6% to 1,291
Nasdaq Composite: Up 1.0% to 2,718
BREADTH FOR NYSE
Advancing Issues: 2,143
Declining Issues: 904
Advance/Decline Ratio: 2.4 to 1
New Highs: 113
New Lows: 10
High/Low Ratio: 11 to 1
SUPPORT/RESISTANCE LEVELS
DJIA: 11,706/12,029
S&P 500: 1,274/1,295
Nasdaq Composite: 2,701/2,766
SECTOR ANALYSIS
Technology was the best performing sectors up 1.4% while Financials and Health Care were the worst performing sectors down 0.1%.
Other Sectors:
Consumer Discretionary Up 0.4%
Consumer Staples Up 0.2%
Energy Up 0.5%
Industrials Up 1.0%
Materials Up 1.1%
Utilities Up 0.6%
OPEN WATCH LIST SYMBOLS (Through Monday, January 22, 2011)
(SH: 42.6919 0.00 0.00%) added @ $46.03 on 11/12/10; current price @ $42.69; 7.3% loss
(PSQ: 33.40 0.00 0.00%) added @ $35.05 on 12/8/10; current price @ $33.40; 4.7% loss
(RWM: 32.30 0.00 0.00%) added @ $32.79 on 12/16/10; current price @ $32.30; 1.5% loss
(UUP: 22.44 0.00 0.00%) added @ $22.80 on 1/14/11; current price @ $22.44; 1.6% loss
(EUO: 19.40 0.00 0.00%) added @ $20.30 on 1/14/11; current price @ $19.40; 4.4% loss
(FDO: 43.44 0.00 0.00%) added @ $44.64 on 1/21/11; current price @ $43.44; 2.7% loss
CLOSED WATCH LIST SYMBOLS
(UUP: 22.44 0.00 0.00%) added @ $22.56 on 10/20/10; removed @ $23.51 on 11/30/10; 4.2% gain
(EUO: 19.40 0.00 0.00%) added @ $19.19 on 10/20/10; removed @ $21.65 on 11/30/10; 12.8% gain
(APOL: 41.87 0.00 0.00%) added @ $37.77 on 10/28/10; removed @ $39.97 on 12/31/10; 5.8% gain
(NUVA: 27.91 0.00 0.00%) added @ $25.11 on 11/12/10; removed @ $26.03 on 12/31/10; 3.7% gain
(DLR: 52.37 0.00 0.00%) added @ $52.22 on 11/26/10; removed @ $53.01 on 12/10/10; 1.5% gain
(CSCO: 21.17 0.00 0.00%) added @ $19.36 on 12/2/10; removed @ $20.91 on 1/6/11; 8.0% gain
(UUP: 22.44 0.00 0.00%) added @ $23.14 on 12/8/10; removed @ $23.37 on 1/10/11; 1.0% gain
(EUO: 19.40 0.00 0.00%) added @ $20.79 on 12/8/10; removed @ $21.73 on 1/10/11; 4.5% gain
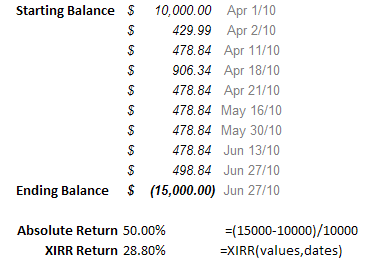
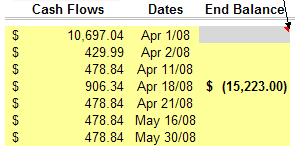
 At first glance, without taking into account the cash deposits, you could be fooled into thinking the return is 50%. However, if you use the XIRR function, the calculated annualized return is much less at 28.8%.As you can see, if the cash flows become longer and irregular with different cash flows, the calculation by hand becomes virtually impossible.Free Spreadsheet to Calculate Annualized and Cumulative ReturnsNow you can calculate your returns quickly and easily with this free spreadsheet to calculate your portfolio returns.Enter your beginning balance at the very top with deposits as positive values and withdrawals as negative values.Enter the date next to each corresponding cash flow and if you need to calculate the return for any particular date, enter it into the third column.
 Just make sure the ending balance is negative with a date to prevent errors.The results will then look like the image below.
 Full credit goes to a site called Gummy Stuff that is unfortunately no longer online for giving me this idea.Download Portfolio Return XIRR Spreadsheet
 Excel 2007 and newer only.No special plug ins required.Just enable macros and run.