Tuesday, May 17, 2011
Japan is not a Bargain
Value Stock Screen Q1 2011 Performance
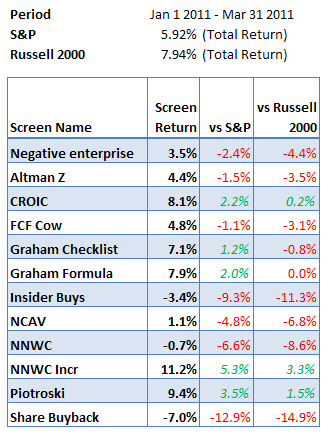 I created these predefined value stock screens in order to keep a constant flow of ideas coming in and to somewhat automate my investment process. The best way to find truly original and off the wall ideas would be to go through every company starting from the A’s in the SEC database, but for most people, this is unrealistic.Through these screens, based off my own research and study, I hope to produce ideas that are not producible with just a free standard screener.The screens are essentially the same as last year, except some parameters have been tweaked and adjusted to account for more realistic trading. A lot of the OTC stocks have been filtered out and I would like to do the same with the Chinese stocks , but that is a hard ask at the moment.The most obvious point jumping out at me is the negative results of the insider buys and share buyback screen. Something I’ll have to look at and see why.On the other hand, the CROIC and NNWC increasing stock screener is continuing last year’s outstanding performance where CROIC returned 44.9% and NNWC increasing returned 43.8%.You can read more about the details of each screen from last year’s performance discussion.User Interface Changes to ScreenersIn case you have not checked out the new site design, the screener section has some changes.The screens are now being displayed as an embedded spreadsheet so that you can easily copy and paste into your own spreadsheet.
Listen to The Intelligent Investor right Now
The Intelligent Investor has supposedly been read by every value investor, but I highly doubt it. If you haven’t read it or just were not able to make it all the way through, you are at the right place.
An audio version of The Intelligent Investor is available for you to download and take with you anywhere. Play it in your car, while working out, or on your favorite music player.
To be able to stream the files or download it, you have to use the widget below. If you are an email reader, come to the site to take advantage of it.
The Intelligent Investor Audio
Tuesday, May 3, 2011
Cellectis Bioresearch First To Launch Revolutionary Custom TAL Nuclease Service
PARIS, Jan. 25, 2011 /PRNewswire/ — Cellectis bioresearch, a specialist in genome customization and a subsidiary of Cellectis (Alternext: ALCLS), has today announced that it will launch gene specific TAL(1) nucleases on February 28, 2011.
Taking advantage of an exclusive license agreement with the University of Minnesota, Cellectis has rapidly integrated TAL effector nucleases into its DNA nuclease production platform. TAL effector nucleases are sequence specific DNA scissors that can be custom engineered to target and modify any gene of interest, in any species. Cellectis is able to produce TAL nucleases in around one week, providing scientists with rapid access to custom-made products.
"This technology has a huge potential and could revolutionize the genome customization world. Being the first to launch TAL nuclease services puts us in an attractive position to gain significant share of the multimillion dollar market for custom DNA nucleases," explained Marc Le Bozec, CEO of Cellectis bioresearch.
"We add yet another asset to our portfolio of important genome customization tools, and invite you to visit our website on February 28, for the official launch of our custom TAL nuclease offer," added Luc Selig, VP Sales and Marketing of Cellectis bioresearch.
About Cellectis bioresearch
Cellectis bioresearch was incorporated as a subsidiary of Cellectis (Alternext: ALCLS) in June 2008. It provides life science researchers with ready- and easy-to-use tools for genome customization. These tools, based on sequence specific endonucleases, enable the engineering of cells with optimized features for drug discovery, protein production and gene function studies. The genome customization products and services can be purchased online from www.cellectis-bioresearch.com.
About Cellectis
Cellectis improves life by applying its genome engineering expertise to a broad range of applications, including agriculture, bioresearch and human therapeutics. Cellectis is listed on the NYSE-Euronext Alternext market (code: ALCLS) in Paris.
Disclaimer
This press release and the information contained herein do not constitute an offer to sell or subscribe, or a solicitation of an offer to buy or subscribe, for shares in Cellectis in any country. This press release contains forward-looking statements that relate to the Company's objectives based on the current expectations and assumptions of the Company's management only and involve unforeseeable risk and uncertainties that could cause the Company to fail to achieve the objectives expressed by the forward-looking statements above.
Portfolio Update Mar 2011

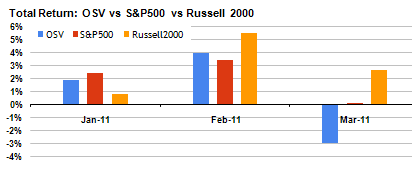 Positive for the year, but lagging behind. Not concerned as my portfolio contains some clearly undervalued but illiquid stocks, making short term performance difficult to judge.What’s with Mr Market?First quarter is out of the way, and with the events that have rolled out in just the first three months alone, I am left scratching my head at how the market is doing so well. While Mr Market obviously feels optimistic, I remain on the cautious side and hesitant in adding new or big positions.Had you told me at the beginning of the year that three major international events (Egypt, Japan, Libya) would be taking place, I would have concluded that buckets of opportunities would exist. Looking at where we are now, Mr Market has recovered and moved on from all three major events.As the market continues on up, it is times like these where sitting and waiting patiently is one of the hardest things to do.Retail Holdings (RHDGF)Throughout the first quarter, I have mostly been monitoring positions and adding on drops.One such addition in March was Retail Holdings (RHDGF). RHDGF announced that it had decided not to pursue the sale of its Bangladesh subsidiary citing “turbulent equity market conditions”.This news brought the stock down 16% and goes to show how inefficient the market is when it comes to international micro cap stocks. Despite the cancellation of the sale, the value of the company remains the same yet it went on sale for a few days before returning to a somewhat more reasonable level.Even at the current price at $15.70, RHDGF is undervalued by as much as 40%. With the CEO owning 20% of the company, special dividends distributed between 2007 to 2009 and management stating that they are looking to monetize assets and return it to shareholders, you have a very shareholder friendly management who understand the value of their business seeking to unlock the value.(I mentioned this on the old school value facebook page by the way)Here are two excellent analyses of RHDGF.Sum Zero analysis of Retail HoldingsDollars for Thirty-Cents: Retail Holdings N.V.Meruelo Maddux Properties (MMPIQ)This bankruptcy special situation investment sure is taking many turns.Greedy management is now sneakily requesting an amendment to the Plan or Reorganization in which they will be able to appoint all seven board members, effectively hoping to eliminate any non insider influence. Debtors are voting to accept the request as it will only benefit them if equity holders disappear.I bought more MMPIQ when it dropped to 40c and will be sending a letter to the Judge ASAP objecting to such amendment requests.If you are a shareholder of MMPIQ, send your letter to the judge ASAP and speak up. Here is a sample letter.Books-A-Million (BAMM)BAMM is having an awful year so far with the falling out of the traditional book retailer sector. Borders group has filed bankruptcy and the perception for brick and mortar bookstores is not getting any better. But it leaves me to think that it has been overdone.BAMM still remains profitable on a full year basis and consistent . Despite a slowdown in the fourth quarter, BAMM should be able to able to produce FCF above $15m when the annual report comes out. On this basis, BAMM would be trading at a P/FCF of 4. Flipping it over, the FCF yield is 25%.At $4, the valuation is becoming ridiculously low. Even with zero growth, given the level of consistency and the health of the company, BAMM should be at a minimum of $6. That’s a potential 50% gain from current levels.But with such negativity surrounding the entire sector, it will take a couple of years before the value becomes recognized or even accepted by the market.Gravity Co (GRVY)The year end result shows that revenue and subscription revenue decreased primarily from Rganarok Online. But the decline has been expected for many years, which is why GRVY has been acquiring games in order to further diversify their income.The effect of this can be seen if you compare the non consolidated financial statement with the consolidated. The addition of the new games is offsetting Ragnarok’s decreasing revenue and better still, GRVY remains in excellent financial health. However, with the acquisitions, the once clean financial statement has now become messier as extra entities make their way into the consolidated financial statement.Cash has obviously gone down with the new game purchases but overall the balance sheet remains healthy with no long term debt.Intangibles has increased 28% which is a large jump. Should any of the newly acquired games fail, expect intangibles to written down.A cause for concern is that accounts receivables increased 32% and accounts payable jumping 70%. While it is too soon to be alarmed at such increases, it does require monitoring.The other big news to anticipate in the second quarter is the long awaited launch of the sequel to Ragnarok Online. This is the big catalyst that I have been waiting for. Thankfully, the current price offers a solid downside protection with an even bigger upside.Brief NotesBOLT: Additional information on their new acquisition is out. Seabotix looks like an interesting company but at the moment, it won’t add too much to BOLT’s operation. Now that i have the new details, I’ll be looking to unload BOLT at the right price.YNGFF: Dropped significantly lately and the company successfully converted existing warrants. The deal wasn’t the best for the company but it certainly is MUCH better then further diluting shareholders to raise capital. It looks like the company was in desperate need for cash but once they complete winterizing the mining facilities, production can go on all year round without any downtime during the winter season.Gold is not likely to drop any time soon and at $1400/ounce, YNGFF will be a very profitable investment in the future. Will take at least 1 year before production can be achieved and to see the levels that I am expecting.RDI: Land on the balance sheet remains hugely undervalued. A simple waiting game. Selling at book value but the land value understates current worth.Disclosure: Long RHDGF, MMPIQ, BAMM, GRVY, BOLT, YNGFF, RDI
Old School Value: The past, present, and future.
Along with the site design, I updated many of the pages and one of them was the about me page. After four years, it needed an update to better reflect what the site stands to achieve.
So let’s take a short break from the regular investment posts and read about the past, present and future of old school value.
Short BackgroundMy dad started “investing” when I was in school but has since turned to day trading in order to pick up daily profits. A profit each day was not guaranteed but I clearly remember the range of emotions he displayed when making and losing money.
Like many people, he acted on stock tips from friends, bought into story stocks and hoped for the lotto stocks.
A lot of our savings was poured in to fund his trading and having witnessed this while growing up, it was no wonder that I grew an incredible negative bias towards stocks.
Stocks were a gamble.
How I got startedBut one day, I became an adult and left home. I got a job and started to think about retirement. I got a retirement account through my employer and didn’t know what to do. So I stuck my money in a random mutual fund that had the highest return over the past 3 years.
Around the same time, I also ended up signing up for variable life insurance and realized my returns were 0% while the insurance sales agent collected all the fees and commissions.
I forfeited my $3,000 account and decided to manage my own money.
How Old School Value got startedWithout having ever taken a finance, accounting or economics class, I didn’t know where to start, so I started by reading books. The Intelligent Investor was the first investment book I read, and to be honest, I found it to be the driest, most boring book I have ever read.
But I kept at it and read more books. Finally, it came to a point where I needed a way to record and apply everything I had read. That’s where Old School Value comes in. It started out as a journal to keep track and to share what I had learned.
Old School Value stands for the old school methodologies of value investing. I have no interest in over leveraging, using complicated option strategies or using margin.
Old School Value TodayOld School Value is now in its fourth year.
Over the years, this site has evolved into a value investing service by offering free and paid stock analysis tools, stock screens and a forum for people to share ideas.
However, Old School Value continues to offer timeless educational material in order to bring as many people into the world of value investing.
The focus here is to keep the quality as high as possible. Rather than publish several articles a week with little substance, I prefer to keep quiet if it is of little importance. This way, I won’t be overloading you with information and you can go through the articles at your own pace.
This is the same for the tools I offer. If something is not worth selling, then it is not worth giving away.
Keeping it RealI am just a regular person. This site is not some second persona where I try to make myself look like a stock picking genius. I’m not.
What I hope people get out of this site is to become open to new ideas, learn new concepts and methods, and then to share it with others. At the same time, I hope people continue to challenge my very own views.
Too many investment sites lack honesty and candidness. If I make a mistake, I will own up to it before anyone else. You will hear about my successes as well as my failures.
My returns are not inflated or displayed in a way to make it seem better than it really is. Being independent, open, honest, transparent and approachable are vital keys for my own development as an investor.
Ethical InvestingInvesting in stocks is investing in businesses, and there are certain types of businesses that I do not wish to support in real life which I apply to my investing. The temptation is always there to make money regardless of industry or company, but I believe investing requires social responsibility.
For this reason, I do not invest in any of the following:
Gambling stocksAlcohol stocksTobacco stocksAdult entertainment stocksMy MissionIn case you have not read the footer, my crazy goal one day is to help sponsor 1,000 children around the world. Currently I do this through a Christian organization called Compassion
The experience of having visited three of the children I sponsor in Colombia, really opened my eyes and heart to what is important. My goal could always be to make more money, but there is more to life than self satisfaction and living comfortably.
I’m not a philanthropist or somebody seeking to change the world. Nor am I am better person than anybody else. I just happen to be moved by helping less fortunate people, while other people are moved by different things.
Through Old School Value, I aim to offer quality tools, articles and information for the small investors. On a personal level, I hope to become independent so that I can focus on giving back as much as possible.
You’ve read my background, you’ve read the objective and you’ve read the mission. That’s what old school value is about and me.
Saturday, April 30, 2011
Stock Market Summary
Stocks finished higher today with the major indexes closing near session highs. In addition, the DJIA posted another new high. Investor participation was ok and market breadth was good. As a result, we are raising the support levels on the DJIA, S&P 500, and Nasdaq Composite (see below). Also, we are increasing the resistance level for the DJIA but leaving it the same for the S&P 500 and Nasdaq Composite (see below). Overall, we continue to believe the prudent approach is continue selling into strength and avoid becoming aggressive with opening new positions in stocks based on how far the stock market direction has run without a significant pullback. Don't let a position turn into a big loss if the market trend suddenly changes. If you need to own stocks, please see our open watch list below.
SUMMARY
DJIA: Up 0.9% to 11,981
S&P 500: Up 0.6% to 1,291
Nasdaq Composite: Up 1.0% to 2,718
BREADTH FOR NYSE
Advancing Issues: 2,143
Declining Issues: 904
Advance/Decline Ratio: 2.4 to 1
New Highs: 113
New Lows: 10
High/Low Ratio: 11 to 1
SUPPORT/RESISTANCE LEVELS
DJIA: 11,706/12,029
S&P 500: 1,274/1,295
Nasdaq Composite: 2,701/2,766
SECTOR ANALYSIS
Technology was the best performing sectors up 1.4% while Financials and Health Care were the worst performing sectors down 0.1%.
Other Sectors:
Consumer Discretionary Up 0.4%
Consumer Staples Up 0.2%
Energy Up 0.5%
Industrials Up 1.0%
Materials Up 1.1%
Utilities Up 0.6%
OPEN WATCH LIST SYMBOLS (Through Monday, January 22, 2011)
(SH: 42.6919 0.00 0.00%) added @ $46.03 on 11/12/10; current price @ $42.69; 7.3% loss
(PSQ: 33.40 0.00 0.00%) added @ $35.05 on 12/8/10; current price @ $33.40; 4.7% loss
(RWM: 32.30 0.00 0.00%) added @ $32.79 on 12/16/10; current price @ $32.30; 1.5% loss
(UUP: 22.44 0.00 0.00%) added @ $22.80 on 1/14/11; current price @ $22.44; 1.6% loss
(EUO: 19.40 0.00 0.00%) added @ $20.30 on 1/14/11; current price @ $19.40; 4.4% loss
(FDO: 43.44 0.00 0.00%) added @ $44.64 on 1/21/11; current price @ $43.44; 2.7% loss
CLOSED WATCH LIST SYMBOLS
(UUP: 22.44 0.00 0.00%) added @ $22.56 on 10/20/10; removed @ $23.51 on 11/30/10; 4.2% gain
(EUO: 19.40 0.00 0.00%) added @ $19.19 on 10/20/10; removed @ $21.65 on 11/30/10; 12.8% gain
(APOL: 41.87 0.00 0.00%) added @ $37.77 on 10/28/10; removed @ $39.97 on 12/31/10; 5.8% gain
(NUVA: 27.91 0.00 0.00%) added @ $25.11 on 11/12/10; removed @ $26.03 on 12/31/10; 3.7% gain
(DLR: 52.37 0.00 0.00%) added @ $52.22 on 11/26/10; removed @ $53.01 on 12/10/10; 1.5% gain
(CSCO: 21.17 0.00 0.00%) added @ $19.36 on 12/2/10; removed @ $20.91 on 1/6/11; 8.0% gain
(UUP: 22.44 0.00 0.00%) added @ $23.14 on 12/8/10; removed @ $23.37 on 1/10/11; 1.0% gain
(EUO: 19.40 0.00 0.00%) added @ $20.79 on 12/8/10; removed @ $21.73 on 1/10/11; 4.5% gain
Listen to The Intelligent Investor right Now
The Intelligent Investor has supposedly been read by every value investor, but I highly doubt it. If you haven’t read it or just were not able to make it all the way through, you are at the right place.
An audio version of The Intelligent Investor is available for you to download and take with you anywhere. Play it in your car, while working out, or on your favorite music player.
To be able to stream the files or download it, you have to use the widget below. If you are an email reader, come to the site to take advantage of it.
The Intelligent Investor Audio
How to Calculate XIRR for Annualized Returns
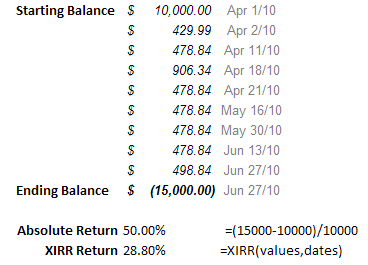 At first glance, without taking into account the cash deposits, you could be fooled into thinking the return is 50%. However, if you use the XIRR function, the calculated annualized return is much less at 28.8%.As you can see, if the cash flows become longer and irregular with different cash flows, the calculation by hand becomes virtually impossible.Free Spreadsheet to Calculate Annualized and Cumulative ReturnsNow you can calculate your returns quickly and easily with this free spreadsheet to calculate your portfolio returns.Enter your beginning balance at the very top with deposits as positive values and withdrawals as negative values.Enter the date next to each corresponding cash flow and if you need to calculate the return for any particular date, enter it into the third column.
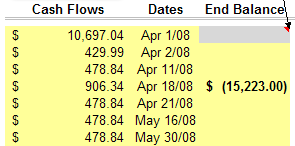 Just make sure the ending balance is negative with a date to prevent errors.The results will then look like the image below.
 Full credit goes to a site called Gummy Stuff that is unfortunately no longer online for giving me this idea.Download Portfolio Return XIRR Spreadsheet
 Excel 2007 and newer only.No special plug ins required.Just enable macros and run.
